Programming is a skill best acquired by practice and example rather than from books. – Alan Turing

In classification, the goal is to predict a class label, which is a choice from a predefined list of possibilities.
If you are new to machine learning check out : Introduction to machine learning
Classification is a supervised machine learning problem where data is collected, analyzed and used to construct classifier by using classification algorithm. These algorithms are used when the value of target output variable is discrete as { Yes| No }
Binary or binomial classification is the task of classifying the elements of a given set into two groups on the basis of a classification rule Example.( Yes/No ), ( True/False ), ( animal/human )
Multi-class or multi-nomial classification is the problem of classifying instances into one of three or more classes
Performance Metrics
Performance matrix and how to calculate them using formulas and sklearn in python
Confusion Matrix
Don’t go on the name it is just a table that tells you which values were correctly predicted and which are not.
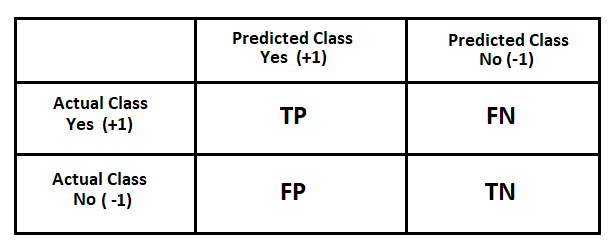
In technical terms: A confusion matrix is a performance measurement technique for Machine learning classification. It is a kind of table which helps you to know the performance of the classification model on a set of test data for that the true values are known.
>>> from sklearn.metrics import confusion_matrix
>>> confusion_matrix(y_actual, y_pred)
True Positive (TP): Result data is positive, and is predicted to be positive.
False Negative (FN): Result data is positive, but is predicted negative.
False Positive (FP): Result data is negative, but is predicted positive.
True Negative (TN): Result data is negative, and is predicted to be negative.
True Positive Rate ( TPR )
It is also called as Sensitivity or Recall or Hit rate
TPR = TP / ( TP + FN )
Recall gives us an idea about when it’s actually yes, how often does it predict yes.
>>> from sklearn.metrics import recall_score
>>> recall_score(y_actual, y_pred)
Sensitivity computes the ratio of positive classes correctly detected. This metric gives how good the model is to recognize a positive class.
Ideally recall must be close to 1, that means there are near to 100% correctly predicted positive cases.
True Negative Rate ( TNR )
It is also called as Specificity.
TNR = TN / ( FP + TN )
Specificity computes the ratio of negative classes correctly detected. This metric gives how good the model is to recognize a negative class.
Specificity measure is used to determine the proportion of actual negative cases, which got predicted correctly.
Ideally Specificity must be close to 1, that means there are near to 100% correctly predicted negative cases.
False Positive Ratio ( FPR )
It is also called as fall-out.
FPR = FP / ( FP + TN )
It is the ratio of all negative classes predicted incorrectly, that is predicted as positive divided by all the classes actually as Negative
FPR = 1- TNR
Ideally FPR must be close to 0.
False Negative Ratio ( FNR )
It is also called as the miss rate
FNR = FN / ( FN+TP )
It is the ratio of all positive classes predicted incorrectly that is predicted as negative divided by all the classes actually as positive
FNR = 1 – TPR
Ideally FNR must be close to 0.
Accuracy
Accuracy tells us how often is the classifier correct?
Accuracy = ( TP + TN ) / ( TP + TN + FP + FN )
>>> from sklearn.metrics import accuracy_score
>>> accuracy_score(y_actual, y_pred)
Ideally Accuracy must be close to 1.
Error rate
Error rate (ERR) is calculated as the number of all incorrect predictions divided by the total number of the dataset.
Error Rate = ( FP + FN ) / ( TP +TN + FP + FN )
Error Rate = 1 – Accuracy
Ideally Error rate must be close to 0.
Precision ( positive predictive value )
Precision is the number of True Positives divided by the number of True Positives and False Positives. Put another way, it is the number of positive predictions divided by the total number of positive class values predicted. It is also called the Positive Predictive Value (PPV).
Precision = TP / ( TP + FP )
>>> from sklearn.metrics import precision_score
>>> precision_score(y_actual, y_pred)
Ideally Precision must be close to 1.
F1 Score
The F1 Score is the 2*((precision*recall)/(precision+recall)). The F1 score is the harmonic mean of the precision and recall.It is also called the F Score or the F Measure.
To put it in simple terms, the F1 score conveys the balance between the precision and the recall.
F1 Score = 2TP / ( 2TP + FP + FN )
>>> from sklearn.metrics import f1_score
>>> f1_score(y_actual, y_pred)
F1 score reaches its best value at 1, which means perfect precision and recall
Classification report
This function in sklearn provides the text summary of the precision, recall, F1 score for each class.
sklearn – Classification report
>>> from sklearn.metrics import classification_report
>>> classification_report(y_true, y_pred, labels=[1, 2, 3])
We will be evaluating performance parameter for some of the classification algorithm.
“Everything that civilization has to offer is a product of human intelligence. we cannot predict what we might achieve when this intelligence is magnified by the tools that AI may provide, but the eradication of war, disease, and poverty would be high on anyone’s list. Success in creating AI would be the biggest event in human history. Unfortunately, it might also be the last.” -Stephen Hawking.
Learn Distances in machine Learning : Go here
