Paneer tikka masala Recipe

Paneer tikka masala is an Indian dish of marinated paneer cheese served in a spiced gravy.

INGREDIENTS

Marination for paneer tikka masala

  • 250 grams paneer cubed
  • ½ cup greek yogurt or thick curd or hung curd
  • ½ tsp ginger garlic paste or crushed ginger garlic
  • ¼ to ½ tsp red chili powder or paprika (less spicy kind)
  • ½ tsp garam masala or tandoori masala
  • 1/8 tsp turmeric (optional)
  • salt to taste
  • ½ small capsicum (optional) or bell pepper (cubed)
  • ½ small onion (optional) cubed & layers separated
    to roast & puree
  • 14 cashew nuts or almonds
  • 1 cup onions cubed (2 medium)
  • 1½ cup tomatoes ripe chopped (3 large)
  • ¾ to 1 tsp red chili powder (or paprika) less spicy kind
  • ¾ to 1 tsp garam masala
  • ¼ tsp salt (adjust to taste)

Gravy for paneer tikka masala

  • 2 tbsps oil or butter
  • 1½ tsp ginger garlic paste
  • 1 tsp sugar
  • 1 tsp kasuri methi (optional) (dried fenugreek leaves)
  • 3 to 4 tbsp cream
  • 2 tbsps coriander leaves or cilantro chopped finely

Preparation to make Paneer tikka masala

  1. Firstly add ½ cup yogurt, ¼ to ½ tsp red chili powder, ½ tsp ginger garlic paste, ½ tsp garam masala, 1/8 tsp turmeric & salt  to a bowl. 
  2. Mix well and check the taste. Add paneer cubes & marinate,
  3. Optional – If using onions & bell peppers, then add ½ cubed onion layers & ½ cubed bell pepper and marinate well. Set this aside until the gravy is done.

How to make Paneer tikka masala

  1. Heat 1 tbsp oil or butter and fry chopped onions until transparent or golden.
  2. Add tomatoes, cashews and sprinkle salt.
  3. Fry all of these until the tomatoes turn mushy and soft.
  4. Then add chilli powder, garam masala, sugar and salt. Fry until the masala smells good.
  5. Cool and blend with ½ to ¾ cup water until very smooth.
  6. Heat 1 tbsp oil in a pan.
  7. Fry ginger garlic paste until the raw smell goes off just for a minute.
  8. Lower the flame and add the onion tomato puree. (Careful as it may splash)
  9. If needed you can optionally add more chilli powder to achieve a brighter color.
  10. Pour ½ to ¾ cup water to bring this to a consistency.
  11. Cover and cook until the gravy turns thick and you see traces of oil on top.
  12. Crush the kasuri methi in your hands and sprinkle it. (optional)
  13. Taste the gravy & add more salt if needed. Rest this aside.

Making paneer tikka in oven or tawa

  1. You can grill in oven or fry the tikkas on stove in a tawa. If making in a oven, preheat the oven to 220 C and thread paneer, onion, bell pepper to a skewer. Then grill for 8 to 10 minutes on both sides.
  2. To make on griddle or tawa. Heat a tbsp oil or butter in a wide pan on a high flame, place the paneer on the tawa and toss them on a high flame till the marinade dries up and it turns golden. Over frying can make it harder and rubbery.
  3. Optional – Similarly place the bell peppers and marinated onions and fry until the marinade dries up.
  4. Transfer grilled paneer tikka along with veggies & onions to the tikka gravy.
  5. Pour the cream. Gently mix.
  6. Garnish with cream and coriander leaves.
  7.  Serve paneer tikka masala with roti, butter naan or veg pulao.

Butter Chicken Recipe

Butter Chicken is one of the most popular curries at any Indian restaurant around the world. Aromatic golden chicken pieces in an incredible creamy curry sauce.

Ingredients

  • 2 pounds boneless (skinless chicken breasts, cut into 1-inch pieces)
  • 2 tablespoons lemon juice
  • 1 tablespoon olive oil
  • 2 teaspoons curry powder
  • 1 onion (thinly sliced)
  • 3 cloves garlic (minced)
  • 1 tablespoon finely chopped ginger root
  • 1 tablespoon olive oil
  • 1 tablespoon butter
  • 1 tablespoon curry powder
  • 1/8 teaspoon white pepper
  • 1/2 teaspoon salt
  • 2 cups tomato puree
  • 2 tablespoons butter
  • 1/2 cup heavy cream or evaporated milk

Steps to Make It

  1. In a medium bowl, place the chicken pieces and sprinkle with lemon juice, olive oil, and 2 teaspoons curry powder. Toss to coat the chicken and set aside.
  2. In a heavy skillet, cook onion, garlic, and ginger in 1 tablespoon olive oil and 1 tablespoon butter over medium heat until fragrant, about 4 minutes. Add 1 tablespoon curry powder, pepper, salt, tomato puree, and 2 tablespoons butter and simmer for 5 minutes, stirring frequently.
  3. Stir the marinated chicken pieces into the sauce in the skillet. Bring back to a boil, then reduce the heat and simmer for about 11 to 15 minutes until the chicken is thoroughly cooked to 165 F as tested with a meat thermometer. Stir in heavy cream or milk and serve Butter Chicken over hot cooked rice (basmati, if you can).
  4. And season to taste. No recipe can be all things to all people. If you like mild dishes, reduce the curry powder. If you like it spicy, add more curry powder and think about adding jalapeño peppers or habanero peppers.

Chocolate cake recipe

Chocolate cake is a cake flavored with melted chocolate, cocoa powder, or both.

INGREDIENTS

Chocolate cake

  • 1 3/4 cups all purpose flour, or (plain flour), (8 oz | 227 g)
  • 3/4 cup unsweetened cocoa powder, (2.6 oz | 75 g) or regular Hershey’s cocoa powder
  • 1 1/2 teaspoon baking powder
  • 1 1/2 teaspoon baking soda, (or bi-carb soda)
  • 1 teaspoon salt
  • 2 cups white granulated sugar, (14 oz | 410 g)
  • 2 large eggs
  • 1 cup milk, (250 ml)
  • 1/2 cup vegetable oil, (125 ml)
  • 2 teaspoons pure vanilla extract
  • 1 cup boiling water (250 ml)

CHOCOLATE BUTTERCREAM FROSTING

  • 4 oz butter, (120 g | 1/2 cup)
  • 2/3 cup unsweetened cocoa powder, or regular HERSHEY’S (2.4 oz | 65 g)
  • 3 cups powdered sugar, (confectioners or icing sugar)
  • 1/3 cup milk
  • 1 teaspoon pure vanilla extract 

Steps to make Chocolate cake

CHOCOLATE CAKE

  1. Preheat oven to 350°F (180°C) standard or 320°F (160°C) fan/convection.
  2. Lightly grease 2x 9-inch (22cm) round cake pans with butter. Line base with parchment paper.
  3. Sift together flour, cocoa, baking powder, baking soda and salt into a large bowl. Whisk in sugar, then add eggs, milk, oil and vanilla. Whisk well to combine until lump free, about 30 seconds.
  4. Pour boiling water into batter, mixing well. Cake batter is thin in consistency.
  5. Pour batter into cake pans and bake for 30-35 minutes or until a wooden skewer inserted into the centre comes out clean.
  6. Let cool for 10 minutes, then turn out onto wire racks to cool completely before frosting.

CHOCOLATE BUTTERCREAM FROSTING

  1. Melt butter, then whisk in cocoa powder. Alternately add powdered sugar and milk, beating to spreading consistency (add a small amount of additional milk, if needed). Stir in vanilla.

k-Nearest Neighbors in Machine Learning (k-NN)

K-Nearest Neighbors is one of the most basic classification algorithms in Machine Learning.

Code and Data-set Link : Github – StuffByYC | Kaggle – StuffByYC

Code and Data-set also available in Downloads section of this website

In this blog we will understand how K-Nearest Neighbors algorithm works. How to Implement it with Python.

KNN algorithm uses “feature similarity” to predict the values of new data-points based on distance.

To see type of distance used in distance based model go to: Type of Distances used in Machine Learning algorithm

Understanding K-Nearest Neighbor

What is K ?

k is the number of neighbors which will help us to decide the class of the new data-point.

Algorithm Steps:

Step 1: Choose the values of “K” that is. the number of neighbor which will be used to predict the resulting class.

Ex. Lets suppose we choose value of k as 5.

There are 2 classes [“Cat” , “Dog” ]. We have to predict if the new data point belongs to class “Cat” or “Dog”.

Step 2: Calculate the distance from the new data point to remaining data points and take k number of the shortest distant neighboring data point. you can choose which distance formula to use. Type of Distances used in Machine Learning algorithm

Ex. Lets suppose the 5 nearest data-point to the New data point “N( x,y ) “ are “A“, “B“, “C“, “D“, “E” that we calculated using euclidean distance method.

Step 3: After getting the “K” nearest data-points, count the categories of the data point ( That is count how many of those k neighbors belong to which categories).

Ex. The class of data points are

A – “Cat”

B – “Dog”

C – “Cat”

D – “Dog”

E – “Dog”

Now count the categories.

“Cats” – 2 and “Dog” – 3

Step 4: Assign the new data point “N” with the class having maximum categories count

Ex. Here category or class “Dog” has the maximum number of category count.

3” out of “5” of the nearest data-point belong to category “dog”

So the new data point “N” will be assigned to class “Dog

Let me know in comments if you have any difficulty understanding this.

Implementing K-Nearest Neighbor

Below we will Implement KNN Algorithm using Sklearn Library.

The task is to Predict if the Customer will purchase the product or not

Code and Data-set Link : Github – StuffByYC | Kaggle StuffByYC

Code and Data-set also available in Downloads section of this website

You need to install the Sklearn library

Open command prompt

pip install scikit-learn

Step 1: We will Import the Libraries

Step 2: Importing the data ( You can find the Sales.csv file in the Github Link above )

Step 3: Splitting Data into training and testing data

Here Test_size = 0.25. It means the out of the dataset that data Allocated for testing is 25%

Step 4: Feature Scaling

What is Feature Scaling ?

As we have learned above we are using distance to predict a particular class. Now in this particular data-set we have salary with value ranging from thousand to 100 thousand and the value of age is within 100.

As salary has a wide range from 0 to 150,000+. Where as, Age has a range from 0 – 60 the distance calculated will be dominated by salary column which will result in erroneous model so we need feature scaling

Feature Scaling is a technique to standardize/normalize the independent features (data columns) present in the data in a fixed range.

Below is the sample transition of data from

X(data) -> X (After train_test_split) -> X (After feature scaling)

Step 5: Fitting the model

Here we will be using euclidean distance so we have set p = 2

Click on : Type of Distance to know more.

K value is set to 5

Step 6: Predicting the test result using the Classifier / Model

Step 7: Calculating Performance Metrics to Evaluate model

Click on Performance metrics to know more

Confusion matrix

True Positive (TP): Result data is positive, and is predicted to be positive.

False Negative (FN): Result data is positive, but is predicted negative.

False Positive (FP): Result data is negative, but is predicted positive.

True Negative (TN): Result data is negative, and is predicted to be negative.

Click on confusion matrix to know more

Recall – 85.29%

Click on recall to know more

Accuracy – 90.53%

Click on accuracy to know more

Precision – 87.88%

Click on Precision to know more

F1 Score

Click on F1 Score to know more

Have successfully implemented K-Nearest Neighbors in python with the help of scikit-learn Library. check out Advantages and Disadvantages of K-Nearest Neighbors

K-Nearest Neighbors – Advantages and Disadvantages

k-nearest neighbors is a very simple algorithm used to solve classification problems.

To Understand and Implement the algorithm Visit – k-nearest neighbors in Machine Learning (k-NN)

Advantages

1. k-NN is called Lazy Learner (Instance based learning). It does not learn anything in the training period. There is no training period. It stores the training dataset and learns from it only at the time of making real time predictions.

2. New data can be added without effecting the algorithm performance or accuracy

3. k-nearest neighbors Algorithm is very easy to implement. You need only two input

  1. Distance (e.g. Euclidean or Manhattan etc.) . Check of type of distance
  2. The value of K

Disadvantages

1. Performance Issue with large data-set: The time required to calculate the distance between the new point and each existing points is huge. Which then degrades the performance of the algorithm.

2. Does not work well with high dimensions / Features: The k-NN algorithm doesn’t work well with large no of Features dimensional data because with large number of Features , it becomes difficult for the algorithm to calculate the distance in each Features .

3. Value of K: It is really crucial to determine what value to assign to k. with different value of K you get different results

Classification and its Performance Metrics in Machine Learning

Programming is a skill best acquired by practice and example rather than from books. – Alan Turing

In classification, the goal is to predict a class label, which is a choice from a predefined list of possibilities.

If you are new to machine learning check out : Introduction to machine learning 

Classification is a supervised machine learning problem where data is collected, analyzed and used to construct classifier by using classification algorithm. These algorithms are used when the value of target output variable is discrete as { Yes| No }

Binary or binomial classification is the task of classifying the elements of a given set into two groups on the basis of a classification rule Example.( Yes/No ), ( True/False ), ( animal/human )

Multi-class or multi-nomial classification is the problem of classifying instances into one of three or more classes

Performance Metrics

Performance matrix and how to calculate them using formulas and sklearn in python

Confusion Matrix

Don’t go on the name it is just a table that tells you which values were correctly predicted and which are not.

In technical terms: A confusion matrix is a performance measurement technique for Machine learning classification. It is a kind of table which helps you to know the performance of the classification model on a set of test data for that the true values are known.

sklearn – confusion matrix

>>> from sklearn.metrics import confusion_matrix
>>> confusion_matrix(y_actual, y_pred)

True Positive (TP): Result data is positive, and is predicted to be positive.

False Negative (FN): Result data is positive, but is predicted negative.

False Positive (FP): Result data is negative, but is predicted positive.

True Negative (TN): Result data is negative, and is predicted to be negative.

True Positive Rate ( TPR )

It is also called as Sensitivity or Recall or Hit rate

TPR = TP / ( TP + FN )

Recall gives us an idea about when it’s actually yes, how often does it predict yes.

sklearn – recall

>>> from sklearn.metrics import recall_score
>>> recall_score(y_actual, y_pred)

Sensitivity computes the ratio of positive classes correctly detected. This metric gives how good the model is to recognize a positive class.

Ideally recall must be close to 1, that means there are near to 100% correctly predicted positive cases.

True Negative Rate ( TNR )

It is also called as Specificity.

TNR = TN / ( FP + TN )

Specificity computes the ratio of negative classes correctly detected. This metric gives how good the model is to recognize a negative class.

Specificity measure is used to determine the proportion of actual negative cases, which got predicted correctly.

Ideally Specificity must be close to 1, that means there are near to 100% correctly predicted negative cases.

False Positive Ratio ( FPR )

It is also called as fall-out.

FPR = FP / ( FP + TN )

It is the ratio of all negative classes predicted incorrectly, that is predicted as positive divided by all the classes actually as Negative

FPR = 1- TNR

Ideally FPR must be close to 0.

False Negative Ratio ( FNR )

It is also called as the miss rate

FNR = FN / ( FN+TP )

It is the ratio of all positive classes predicted incorrectly that is predicted as negative divided by all the classes actually as positive

FNR = 1 – TPR

Ideally FNR must be close to 0.

Accuracy

Accuracy tells us how often is the classifier correct?

Accuracy = ( TP + TN ) / ( TP + TN + FP + FN )

sklearn – Accuracy

>>> from sklearn.metrics import accuracy_score
>>> accuracy_score(y_actual, y_pred)

Ideally Accuracy must be close to 1.

Error rate

Error rate (ERR) is calculated as the number of all incorrect predictions divided by the total number of the dataset.

Error Rate = ( FP + FN ) / ( TP +TN + FP + FN )

Error Rate = 1 – Accuracy

Ideally Error rate must be close to 0.

Precision ( positive predictive value )

Precision is the number of True Positives divided by the number of True Positives and False Positives. Put another way, it is the number of positive predictions divided by the total number of positive class values predicted. It is also called the Positive Predictive Value (PPV).

Precision = TP / ( TP + FP )

sklearn – Precision

>>> from sklearn.metrics import precision_score
>>> precision_score(y_actual, y_pred)

Ideally Precision must be close to 1.

F1 Score

The F1 Score is the 2*((precision*recall)/(precision+recall)). The F1 score is the harmonic mean of the precision and recall.It is also called the F Score or the F Measure.

To put it in simple terms, the F1 score conveys the balance between the precision and the recall.

F1 Score = 2TP / ( 2TP + FP + FN )

sklearn – f1 score

>>> from sklearn.metrics import f1_score
>>> f1_score(y_actual, y_pred)

F1 score reaches its best value at 1, which means perfect precision and recall

Classification report

This function in sklearn provides the text summary of the precision, recall, F1 score for each class.

sklearn – Classification report

>>> from sklearn.metrics import classification_report
>>> classification_report(y_true, y_pred, labels=[1, 2, 3])

We will be evaluating performance parameter for some of the classification algorithm.

“Everything that civilization has to offer is a product of human intelligence. we cannot predict what we might achieve when this intelligence is magnified by the tools that AI may provide, but the eradication of war, disease, and poverty would be high on anyone’s list. Success in creating AI would be the biggest event in human history. Unfortunately, it might also be the last.” -Stephen Hawking.

Learn Distances in machine Learning : Go here

Type of Distances used in Machine Learning algorithm

Distance metric are used to represent distances between any two data points. There are many distance metrics, but in this article, we will only be discussing a few widely used distance metrics.

If you are new to machine learning check out : Introduction to machine learning 

Type of Distances:

  1. Manhattan distance
  2. Euclidean distance
  3. Minkowski distance
  4. Hamming distance
  5. Mahalanobis distance

Manhattan Distance

The Manhattan distance as the sum of absolute differences

In a plane with p1 at (x1, y1) and p2 at (x2, y2), it is |x1 – x2| + |y1 – y2|.

Example:

Lets calculate Distance between { 2, 3 } from { 3, 5 }

we put it in formula

|2-3|+|3-5| = |-1| + |-2| = 1+2 = 3

In 3-D space Manhattan Distance example: [{a, b, c}, {x, y, z}] :

Abs [a − x] + Abs [b − y] + Abs [c − z]

Euclidean distance

The Euclidean distance between two points in either the plane or 3-dimensional space measures the length of a segment connecting the two points.

Example:

Lets calculate Distance between { 2, 3 } from { 3, 5 }

we put it in formula

Minkowski distance

Minkowski distance is a generalization of the Euclidean distance and the Manhattan distance. Minkowski distance is applied in machine learning to find out distance similarity.

If C = 1 it is Manhattan Distance.

If C = 2 It is Euclidean distance.

Hamming distance

Hamming distance is a metric for comparing two binary data strings.

If ‘p’ and ‘q’ are binary strings then hamming distance is the number of bits required to convert from ‘p’ to ‘q’ or in other terms the number of different bits

Lets consider two binary string A = ‘010’ and B = ‘011’

Then if you change the 3 bit of string A ( 010 ) that is 0 to 1 the you get B ( 011 ) therefore the number of bits required or the number of different bits is 1 so the hamming distance for the above two string is 1 .

Mahalanobis Distance

Mahalanobis distance between two vectors, x and y, where S is the co-variance matrix.

co-variance of two feature indicated how values of two features are varying together. It measure how values of one feature are varying according to values of another feature.

The Mahalanobis distance uses inverse of co-variance matrix. The ‘T’ in equation indicates transpose of a matrix.

Introduction to Machine Learning

Some of the most important question we first ask about any topic are What ? Why ? How ?. You will find a lot of paid courses on Machine learning. Here I will creating a complete series of Blogs on Machine learning after that deep learning and Artificial Intelligence. So lets start with the base question of any topic. What is it ?

A computer would deserve to be called intelligent if it could deceive a human into believing that it was human Alan Turing

What is Machine Learning ?

Machine Learning is a branch on science that deals with programming the system in such a way that they automatically learn and improve with experience.

To put it in simple words think of any task a human does like arranging a desk or shelf. First we put thinks in order how good they look. but, after some time we arrange it according to how frequently we use things on the shelf. Like, we put the book that we are reading in a place which is easily accessing an not behind a pile of Books having good cover page. This is done when you get the experience and come to a conclusion that accessibility is more important that appearance in case of arranging the books.

Similarly, In Machine Learning we use data for gaining experience ( Experience is ML might be as simple as changing value of few variable in a formula by using the data).

Learning Means recognizing and understanding the input data and making wise decisions based on the supplied data. Algorithm builds knowledge from specific data and past experience with the principles of statistics, probability theory, reinforcement learning, etc.

What are the two broad categories of Machine learning tasks ?

1. Supervised Learning

2. Unsupervised Learning

Supervised Learning

Supervised learning is where you have Input variables ( x ) and an output variable ( y ) and you use an algorithm to learn the mapping function from the input to the output.

y= f(x)

The goal is to approximate the mapping function so well that when you have new input data ( x ) that you can predict the output variable ( y ) from that data

In Supervised learning the model is trained on a labelled dataset. Labelled dataset is one which has both input and output parameters.

It is called supervised learning because the process of an algorithm learning from the training data set can be thought of as a teacher supervising the learning process

The algorithm iteratively makes prediction on the training data set and is corrected by the teacher ( correct answer ).

There are basically two type of supervised learning

  1. Classification
  2. Regression

1. Classification

The main goal of classification is to predict the target class ( Yes/No ), ( True/False ), ( animal/human )

These algorithms are used when the value of target output variable is discrete as { Yes| No }

Binary or binomial classification is the task of classifying the elements of a given set into two groups on the basis of a classification rule

Multi-class or multi-nomial classification is the problem of classifying instances into one of three or more classes

Example : classifying email to predict if the email is a Spam mail or not

2. Regression

Regression is a technique for predicting the value of dependent variable as a function of one or more independent variable in the presence of random error.

In simple terms Regression is used to predict continuous values. It is a statistical processes for estimating the relationships between a dependent variable and one or more independent variables.

Example: Predicting house prices of a particular area.

Unsupervised Learning

Unsupervised learning is where you only have input data ( x ) and no corresponding output variable

The goal for unsupervised learning is to model the underlying structure or distribution in the data in order to learn more about the data

It is called unsupervised learning because unlike supervised learning there is no Labelled data that means no correct answer or no teacher.

Unsupervised learning problems can be further grouped into two parts

  1. Clustering
  2. Association Rule Mining

1. Clustering

A clustering problem is where you want to discover the inherent grouping in the data such as grouping customers by purchasing behavior

In simple terms Cluster analysis or clustering is the task of grouping a set of objects in such a way that objects in the same group are more similar to each other than to those in other groups

Example : Suppose you have data of all the products sales from your store and you want to assign priority to customer in order to boost sale by giving offers according to priority. you can use clustering algorithms to generate cluster of people and assign priority accordingly.

2. Association Rule Mining

An association rules learning problem is where you want to discover rules that describe large portions of your data, such as people that buy X also tend to by Y.

Association rule learning is a rule-based machine learning method for discovering interesting relations between variables in large databases.

Example: Market basket analysis – It is used in deciding the location of items inside a store. ex.If someone buys a packet of milk also tends to buy bread at the same time.

We will get into details of explanation of each algorithm and task Blog by Blog.

Now lets get to the second important question …

Why Machine Learning ?

Most of us know the answer to this question. I will try to example in too. Humans, most of the time have a lot of things to focus on. Now just image if we were made to do one and only one task and now if we could do that task without the need to take break or rest.

With the help of machine learning we can focus on a single task with more precision than human and machine do not need rest or time off. Machine learning is a way to reduce human efforts.

Some of the task are very complex for a human mind and some are easy but takes time. Example take simple calculation but with big number. Best of best would still require a few second. But, for machine 1 second is similar to eternity depending on the processing power the machine has.

The base reasons are machine is faster, Machine needs no rest and if we have the resources to make machine do our activity we could focus on much more important problem in the world.

There are a lot of reasons to this why statement. Give some of your reasons in comment section.

The final question

How does it work ?

I will be creating a Series of Blogs in which I will try and explain most of the models of machine learning and how to implement them in python and how the algorithm works. Stay Tuned…

Create Android, iOS, Windows, Linux Application using one platform

Develop iOS, Android, Windows application with single piece of code. There is no need to develop application in three different platform.

We all have ideas to develop some or the other applications which will ease our daily work. But, we avoid creating such applications due to the lengthy coding or time investment required to create a simple app.

Kivy is relatively a very easy language which helps in creating amazing applications. You can create single code for your application using kivy and generate windows, Andoid, iOS, OS X applications. Additional point Kivy is a free and open source Python library.

Using kivy could reduce the effort and time because you will not have to use different platform like android studio, Visual studio, Xcode for creating your application and kivy is a relatively easy to code.

Below is the sample code in Kivy

Kivy – Open source Python library for rapid development of applications that make use of innovative user interfaces, such as multi-touch apps. Kivy runs on Linux, Windows, OS X, Android, iOS, and Raspberry Pi.

I have created a sample calculator application using Kivy and Python and uploaded it to amazon store and https://www.stuffbyyc.com/ download section .

Check out the code

Github: https://github.com/StuffByYC/Kivy_Calculator

I have exported it for two of the above platform. To Check out the final output

Android : https://www.amazon.com/gp/product/B085RZMF6T

Windows : http://wix.to/xsD9CEc

Crack IELTS in just 14 days

” First and foremost advise, book your Exam it helps provide a boost and motivation for your studies” – YC

The International English Language Testing System, or IELTS, is an international standardized test of English language proficiency for non-native English language speakers, which is a mandatory exam if you are looking to study abroad

IELTS has been developed by some of the world’s leading language assessment experts and will test the full range of English skills needed for success in your new job or study placement abroad.

You’ll be assessed on the following elements:

  1. Listening
  2. Reading
  3. Writing
  4. Speaking

You will give Listening, Reading, Writing section on one day and the Speaking test will most probably be set 2-3 days prior of L/R/W test.

There are two IELTS tests available – IELTS Academic and IELTS General Training. The test you choose should be based on what it is you want to do.

  • IELTS Academic – measures whether your level of English language proficiency is suitable for an academic environment. It reflects aspects of academic language and evaluates whether you’re ready to begin training or studying.
  • IELTS General Training – measures English language proficiency in a practical, everyday context. The tasks and tests reflect both workplace and social situations.

IELTS General Training exam just differs in writing part -1, rest every other module of general and academic is the same. Writing part-1, in general, is Letter writing and in academic it is writing a summary of a graph. Both exams are only different in their difficulty level and scoring system.

IELTS Score Calculator

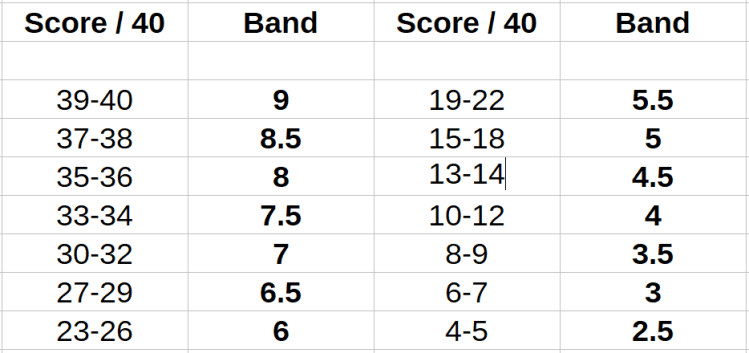
All IELTS scores are between 0 and 9. You can also get .5 scores as well (for example, 6.5 or 7.5). You will get a band score for each skill ( listening, reading, writing and speaking ) and also an overall band score. The overall band score is the average score of all the skills.

  • If your overall score is an average of 6.25, your score will be increased to 6.5.
  • If your overall score is an average of 6.75, your score will be increased to 7.
  • If your overall score is 6.1, your score will go down to 6.
  • Your score is rounded up or down to the nearest 0.5 or whole score

IELTS

IELTS is not a difficult exam. I will be listing out the 4 parts and the time to be spent on the four parts.

The Writing section in IELTS is one of the difficult parts. Listening and Reading are the easiest sections to get a perfect score that is band 9. The Study material is provided below

Listening

The IELTS Listening test will take about 30 minutes, and you will have an extra 10 minutes to transfer your answers to the answer sheet. Total 40 mins round

The Listening test is the same for both the IELTS Academic and IELTS General Training tests.

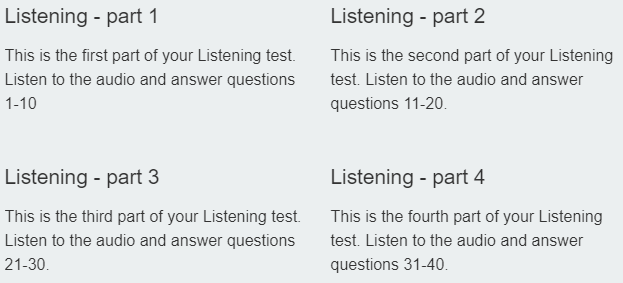
The four parts of this practice Listening test are presented over four separate web pages. There are 40 questions altogether. Each question carries one mark.

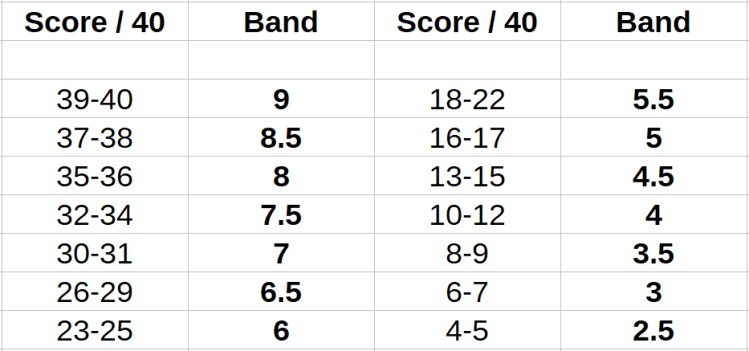
Listening Score chart

Study Material – 3 Days or 5 hours

Listening is one of the easiest modules requires less time to be spent on. You can vary the time you spend on this module but my recommendation is 3 Days. It is enough for you to do a mock test and receive a good score

You can do practice mock test on Youtube. Many Youtubes channel provide a sample listening test daily. I would suggest for you to do At least 10-12 of them it usually takes around 30 mins for each test.

You will need 3 tests just to get in the flow then 5-7 test to Practice and 3 tests for reviewing yourself.

The best way to get a band 9 in Listening is to be patient and clear your head before appearing for the test

I have provided a youtube channel link below. Videos are also categorized in their difficulty level. I would suggest Starting with Easy go to Impossible the down to hard and very hard then back to Impossible.

The IELTS Listening Test :

https://www.youtube.com/channel/UCIgELCOfrcYA9jWF4TOJUnQ/videos

Tip :

  • Just remain calm and patient.
  • Some time question with Fill in the black or more than two word answer might be tricky so listen carefully to them
  • If there is a Map related question draw a north, south east west symbol pointing directions
  • Try to forget the previous section as soon as possible

Speaking

Then Speaking section includes 3 parts. Total time required for the Speaking round will be 11-14 mins In the Speaking test, you will have a discussion with a certified examiner. It will be interactive and as close to a real-life situation as a test can get.

The Speaking test is the same for both IELTS Academic and IELTS General Training tests.

Speaking Part – 1 ( 4-5 Mins)

In part 1 of the Speaking test, the examiner will introduce him or herself and ask general questions on familiar topics. It is similar to a very short interview of Introduction. Basically, you will be asked getting to know yourself type of question

The examiner will ask you to confirm your identity. He or she will then ask general questions on familiar topics such as home, family, work, studies and interests. Part 1 of the test will last 4-5 minutes.

Speaking Part – 1 sample questions

  • what kind of place is it?
  • what’s the most interesting part of your town/village?
  • what kind of jobs do the people in your town/village do?
  • would you say it’s a good place to live? (why?)
  • tell me about the kind of accommodation you live in?
  • how long have you lived there?
  • what do you like about living there?
  • what sort of accommodation would you most like to live in?

Speaking Part – 2 ( 3-4 Mins)

In the IELTS speaking part 2 test, you will be given a task card on a particular topic, and this will include key points that you should talk about.

Part 2 is a very short speech on a topic.

  1. You will have 1 min to prepare yourself.
  2. You will have to talk for 1-2 minutes.
  3. Then the examiner will ask you one or two questions on the same topic.

Part 2 takes 3-4 minutes in total.

Speaking Part – 1 sample Topics

The topics given to you would also contain some pointer or hints on what to talk about. It is not necessary to stick to the points you can talk freely about the topic just keep a good flow

Example 1

Describe a piece of art you like

you can say:

  • What type of art you like
  • when you first saw it
  • why you like it

Example 2

Describe a movie you recently saw

you can saw:

  • Name of the movie
  • What is it about
  • What type of movie was it
  • Explain if you liked it or not

Speaking Part – 3 ( 4-5 Mins)

In part 3 of the Speaking test, the examiner will ask further questions that are connected to the topics discussed in part 2.

This part of the test is designed to give you the opportunity to talk about more abstract issues and ideas. It is a two-way discussion with the examiner and will last 4-5 minutes.

It is a type of in detail interview based on the Part 2 section of speaking

Speaking Part – 1 sample Questions

Let’s consider first of all how people’s values have changed.

  • What kind of things give status to people in your country? 
  • Have things changed since your parents’ time?

Finally, let’s talk about the role of advertising.

  • Do you think advertising influences what people buy?

Study material – 3 Days 3-4 Hours

You do not require much study material for Speaking exam. When you register for IELTS you will receive a book within a few days by post depending on your location.

You will have a lot of sample questions and several topic cards in the book. That is enough for your speaking test.

The IELTS Listening Test :

https://www.youtube.com/user/AcademicEnglishHelp/videos

Tips

  • show confidence in your voice
  • The Examiner there will just record your voice your body language and you facially cues are not considered will marking
  • Be calm do not jump to answering let the examiner finish questions first
  • Pronounce clearly.
  • Don’t worry if you make mistakes just keep talking
  • If the questions are a bit difficult or require thinking. Say: It is an Interesting question. I have not thought about it like that give me a second to think
  • Your pace is not important. your clarity is, so don’t speed up too much be clear
  • You might get stuck in section 2 on the short speech here you need to think out loud. talk about it. like: I am so nervous. There are so many things to say I have difficulty picking one. Buy time for yourself by making small talk and think. Don’t make it an awkward silence

Reading

Reading is the easiest of them all. You already have the answer and questions you just need to find it.

You will be allowed 1 hour to complete all 3 sections of the IELTS Academic or General Reading test.

The three parts of this practice Reading test are presented over three separate web pages. Make sure you move swiftly from one page to the next so that your practice is as realistic as possible.

I would suggest to allocated 20 mins to each passage give or take 3-5 mins. You only have 1 hour. Time is a very important factor in this section.

Reading Score chart

Study material – 3 Days 10-12 Hours

When you register for IELTS you will receive a book within a few days by post depending on your location.

I will describe my technique of cracking IELTS reading. I got a Band 9 in reading

I first quickly go through questions and pick out name, year, or number specified in the question and Underline them. Then I take a glance at the complete passage and get an idea of what is where while marking each and everything that looks important specifically the name and numbers. Then I try and give a name/title to the paragraph that is relevant.

Almost 90% of questions are sequential to the paragraphs. Then read one paragraph thoroughly then answers question sequentially.

Some Reading sample:

https://www.ielts-exam.net/ielts_reading/

I would suggest you to prefer the book you receive from British council. It will give you the actual feel of exam.

Tips:

  • Answer questions sequentially
  • Don’t waste too much time on one question if you cant answer it move to the next one
  • keep a watch on time
  • Try to finish each passage in 18 mins so at the end you can come back to unanswered/doubtful questions and have 6 mins to answer them
  • Try to forget the previous passage as soon as you jump to the next one. Clear your mind before moving to next passage

Writing

This is the most difficult module to score a high band in, but for above average score, it is not that difficult. In this post we will only be discussing IELTS academic Writing.

The writing module is for 1 hour. I would suggest you invest 20 mins for Writing part-1 and 40 mins on Essay

There are two parts in the writing module:

Writing Part-1 (20 mins Approx.)

You need to write 3-4 paragraphs and 150+ words. If you write less than 150 words marks will be deducted

In the initial paragraph, you need to paraphrase the question. Start the paraphrase with one of the following prompts,

  • The table shows/illustrates the trends in …. between …….
  • The graph shows……
  • The chart shows how the ….. have changed ……

I recommend you use this Structure

One Graph, Chart, or Table

Paraphrase the Prompt

Overall, Describe the main trends(Time) / Features (Things)

Compare the Data in details

Summary Sentence (Optional)

Two Graphs, Charts, or Tables

Option 1

Paraphrase the Prompt

Overall

Describe and compare the main trends(Time) / Features (Things) in Graph 1

Describe and compare the main trends(Time) / Features (Things) in Graph 2

Summary Sentence (Optional)

Option 2

Paraphrase the Prompt

Overall

Describe and compare the main trends(Time) / Features (Things) in Graph 1 and 2

Describe and compare the main trends(Time) / Features (Things) in Graph 1 and 2

Summary Sentence (Optional)

Three Graphs, Charts, or Tables

Paraphrase the Prompt

Overall

Describe and compare the main trends(Time) / Features (Things) in Chart 1

Describe and compare the main trends(Time) / Features (Things) in Chart 2

Describe and compare the main trends(Time) / Features (Things) in Chart 3

Summary Sentence (Optional)

Writing Part-1 types

  1. Line Graph
  2. Bar Chart
  3. Pie Chart
  4. Tables
  5. Diagram
  6. Maps
  7. Mixed Charts

Writing Part-2 Essay (40 mins Approx.)

In this part, you need to write an essay. I have search rigorously and found out this structure. You need to write 4-5 paragraphs and 250+ words. If you write less than 250 words marks will be deducted

I recommend you use this Structure

Introduction

Paragraph 1

Paragraph 2

Conclusion

Introduction Structure

Neutral background sentence

Rewrite the question

This essay will..

Paragraph Structure

Opening sentence

Supporting sentence

Evidence

Closing Sentence

Conclusion

This essay discussed …

Broad statement of Topic

Summary

Writing Part-2 types

  1. Problem / Solution
  2. Double Question
  3. Agree / Disagree
  4. Discuss Both views
  5. Discuss both view and give your opinion
  6. Advantages/ Disadvantages
  7. Advantages/ Disadvantages and give your opinion

Study material – 5 Days 10-15 Hours

https://www.ielts-exam.net/academic_writing_samples_task_1/

https://www.ielts-exam.net/ielts_writing_samples_task_2/

Sign up for free in E2 language. Very good training in the free module itself

https://www.e2language.com/

Tips:

  • Take 1-2 mins to analyze what is given to you
  • Summarize your thinking in one or two words for each paragraph and write it down
  • Keep track of time
  • You don’t have to write out of the box here you are tested for English, don’t waste too much time thinking
  • Keep 1-2 mins at the end for checking your grammar and spellings

In All, IELTS is not a difficult exam with the study material and stuff mentioned here you can get a very good band score.

Design a site like this with WordPress.com
Get started